Blog Listing

LAST WEEK'S RELEASES (2)

Temperature monitoring in the datacenter
Monitoring of the environment parameters in a datacenter is very important for normal operation. Moreover, having a clear picture of the current values, trends and deviations will ensure system uptime, optimize performance and reduce operational costs.
Properly setting alarm triggers will send early alarm notices and give operational staff more time to eliminate faults and manage repairs.
There are no doubts that monitoring systems must be adapted to the specific design and purpose of the infrastructure, equipment sensitivity, air conditioning system redundancy etc.
E.g. the monitoring of high power density server racks in hot/cold aisle configuration is different from the one in the equipment container, exposed to the elements at a remote location.
Last, but not least, the monitoring system design and operation falls outside the core tasks of network engineers and administrators, it often requires different and specific skills and malfunctioning or improper functioning often has no direct impact on operations - especially in early stages. It is therefore often underestimated and pushed aside in fovor of more urgent problems until disaster strikes.
In order to properly design, commission, operate and maintain our critical infrastructure monitoring systems we need to identify the key parameters and characteristics such systems must have.
In this article we will try to summarize all aspects we need to consider when solving this task-both general and specific ones. Your project may differ, but our solution is flexible enough to answer most needs, scopes and sizes.
What are the needs
Let’s see what problems we must address with our monitoring system.
-to be easy to install in diverse environments;
-to not disturb operation of other systems;
-to operate on 24/7/365 basis;
-to be in a redundant configuration;
-to keep history data to a predefined period of time;
-to be scalable and adjustable;
-to generate and clear alarm alerts via different media and at predefined thresholds with predefined severity levels;
-to be easy to integrate it in other management and monitoring systems;
-to stay within reasonable budget limits;
-to occupy a small space in the rack and in the datacenter and to have a lower power consumption;
-to not interfere with other systems;
-to be able to express the data in different formats for preselected periods of time and to be easy to switch between general view and detailed view;
-to be able to backup configuration and stored data;
-to easily add, delete and modify configuration, following current changes and demands;
And lastly – to comply with the applicable standards
Talking about standards, it is important to mention ASHRAE 90.4 was finalized and went into effect in 2016 and recently was replaced by ASHRAE 90.4-2019.
ASHRAE 90.4 standard establishes the minimum energy efficiency requirements of data centers for design, construction, operation and maintenance and utilization of on-site or off-site renewable energy resources. The standard also stipulates means for temperature monitoring, requiring minimum 3 sensors at the inlet and outlet of every rack-one at the top, middle and bottom section. That means that the monitoring system must maintain minimum six sensors per equipment rack.
The solution
There are many “turn-key” and ready to use monitoring solutions on the market. You can find information by searching the Internet or talking to your datacenter construction/maintenance contractor. In our opinion almost all of them are either not answering all problems, as listed above, or are too expensive, or require additional work/upgrade to be done in order to achieve full functionality. E.g. there are nice monitoring systems delivered with WEB interface only. They have SNMP interface but need extra work to integrate them in the operator’s existing SNMP monitoring system or develop a complete new one, dedicated to environment monitoring only.
Below I would like to show how you can create and integrate an excellent environment monitoring system within a very small budget.
The components
We will need good, reliable and cheap sensors, easily addressable, with compact size and simple and easy deployable cabling.
We will need a server, capable of retrieving information, storing, visualizing and analyzing it and triggering alarms.
We will need a converter, capable of converting sensor’s data into format, readable by the server.
Sensors
For this project we have selected addressable 1-wire sensors. There are many options here, but our team prefers the DS18B20 sensor as shown on the picture below. It is water and dust esistant with index of protection IP 67. The sensor has a stainless steel protective cap with a diameter of just 6mm and length 50mm and comes with 1 m pre-terminated cable

The DS18B20 provides 9-bit to 12-bit Celsius temperature measurements and communicates over 1-Wire bus that, by definition requires only one data line and ground for communication. The operating temperature range is between -55°C to +125°C and is accurate to ±0.5°C over the range of -10°C to +85°C-more than enough for our datacenter monitoring requirements. It is important to mention that, for temperatures below 100°C the sensor can derive power directly from the data line (“parasite power”), eliminating the need for an external power supply. Although we don’t use this functionality, it might be useful in some particular applications.
Each sensor has a unique 64-bit serial code, which allows multiple sensors to function on the same 1-Wire bus. Thus, it is simple to use one controller to control many sensors distributed over a large area. The sensor converts temperature to 9, 10, 11 or 12-bit digital word in maximum 750ms. This corresponds to increments of 0.5 °C, 0.25 °C, 0.125 °C and 0.0625 °C respectively.
What makes it an even better solution for our needs is the price of less than 3 Euro. Please note that the price depends on the number of pieces ordered. As we will need a minimum of 6 sensors per rack, bulk orders are preferred.
And of course, you may use different 1-wire sensors or the same sensor in different housing, depending on your particular needs and selected installation method.
Now onto how to mechanically install the sensor into the rack. There are many options-from simply placing it over a tray or equipment top, binding to 19” railing with cable ties, sticking it to the rack with a hot glue gun, silicone, adhesive tape or other.
We do it with a PG 7 cable gland, attached to a stainless steel bracket with appropriate holes, depending on the rack type and size. You can order several types of brackets for 19” racks, 21” racks, wall mount, ceiling mount etc. The bracket must have an opening for PG 7 cable gland –typically 13 mm in diameter. The sensor is housed into the cable gland and cable may be attached to 1-Wire bus using 3 pcs. 3 poles Wago splicing connectors for 0,75-2,5 mm2 stranded wires.


For 1-Wire bus we use 3 x 0,75 mm2 cable with stranded wires, preferably with halogen-free insulation.

Now we have a perfect sensor and good means to install it in the rack or elsewhere in the datacenter. I would like to mention that this sensor is water/dust proof and UV resistant, due to the stainless-steel housing and is appropriate for outdoor use as well. At all our facilities we use DS18B20 sensors to monitor ambient temperature as well.
But a good sensor is not enough to have a fully functional monitoring system. We need a server to collect, store, retrieve, visualize, process all the data coming from the sensors. We need to trigger alarms and set minimum and maximum values. Unfortunately WEB interface of some ready-made systems is not sufficient for achieving that.
What options do we have-our team focused on industrial control systems (ICS), including SCADA (Supervisory Control And Data Acquisition) System or SNMP (Simple Network Management Protocol) systems.
ICS are typically used in industries such as electric, water, waste water, oil and natural gas, transportation, manufacturing.
SNMP is a general purpose protocol which is widely used by the IT community to manage and monitor network equipment and is part of TCP/IP stack. The communication is generally between a management station and an agent-remote device. In broad terms SNMP consists of:
- at least one, but generally many devices that contain an SNMP application component that exposes elements of its configuration or operation for management through the SNMP protocol. These devices are referred as agents.
-at least one, but potentially more SNMP nodes that are capable of initiating management commands and/or receiving monitoring notifications from other devices-These nodes are referred as a manager.
As datacenter operations require deployment of at least one SNMP management system, we have decided to focus on SNMP and base our environment monitoring on SNMP. I would like to stress that there is absolutely no reason to use separate SNMP system just for environment monitoring. It can be integrated into your existing SNMP system following techniques, described below.
There are plenty of paid and free SNMP monitoring tools. Among them are Solarwinds, PRTG, ManageEngine OpManager, Nagios, Pandora, Cacti, Zenoss Core and many more. Any can do the job but for our project we selected Zabbix 4. Zabbix is a splendid enterprise-level software designed to monitor everything from performance and availability of servers, network equipment to web applications and databases. It is a server-agent system architecture where you get to install the agent on the server (client) to be monitored by the Zabbix server, but it supports SNMP agentless monitoring as well.
Zabbix servers can be installed on different Linux distributions. For our project we used Ubuntu 18.04 on a dedicated server, but there is absolutely not a problem to use a virtual machine as well. You can download Zabbix packages for your OS distribution from their web site https://www.zabbix.com
We don't go into details about Zabbix server installation and technical requirements for server hardware. You can find such relevant information on the Internet or in our other posts.
A Zabbix server can collect data from devices with SNMP agent versions 1, 2 or 3. Zabbix supports the standard SNMP MIB-2, as well as specific information on an Enterprise MIB. You can collect data by using the SNMP polling mode or receiving SNMP traps through the snmptrap daemon and zabbix_sender utility. Additionaly, you can get SNMP data with the use of dynamic indexes offering monitoring that is flexible and without performance degradation, since the resolution queries are cached.
As soon as data is collected, using different methods available in Zabbix, the process of evaluating the collected data begins. Data evaluation rules, or trigger expressions, in terms of Zabbix, provide logical definitions of a problem state for temperature data received from monitored sensors. When a certain threshold is reached, the trigger changes its state from OK to PROBLEM and also back when data is below threshold. In addition to that, Zabbix can be used to predict problems by analyzing the trend of incoming data and constructing a forecast of how things are likely to go, giving users the ability to act proactively.
Zabbix provides its users with very flexible, intelligent threshold definition options. While a threshold for a trigger may be as simple as "bigger than x", it is possible to use all logical expressions, such as division, multiplication, not equal, logical AND as well as OR. This can be of use when defining a threshold in case of extreme ambient temperatures, peak busy hours equipment load/power consumption or air conditioning maintenance periods.
Zabbix can use many different items obtained from different hosts to build a trigger expression and implement dependencies, when failure in one node is responsible for the failure of operation in many other parts of the environment. This allows to build a very complex, intelligent thresholds, which minimizes false positives and thus lets administrators concentrate on real issues. That can eliminate “alarm flooding” situations, where one fault causes occurrence of many alarms in different nodes, related with that single node. Using the complex trigger expression can diversify different alarms by severity level and not generate lower level alarms when a higher level alarm is present. For example you don’t need “High temperature alarm” with severity level “High”from each 6 sensors of every rack if there is room temperature alarm with severity level “Disaster” caused by air conditioning malfunctioning or power outage.
Zabbix also has a hysteresis function that allows to avoid flapping when incoming data is fluctuating around the threshold.
It is important to mention the excellent graphs generation capabilities of Zabbix. You can use automatic graphs, generated on runtime from each item. Controls allow to change the displayed time period or chose predefined, often used time periods as day, week, month, last week to date etc.
On the picture below you can see the temperature data of one sensor for the last 1 day.

Users can create custom graphs where data of several items can be compared or ad-hoc graphs for several items, where you can create a comparison graph.
Zabbix offers the creation of a different maps where the users can display values of different items over an optional background image for an user-friendly overview. An example of different racks in a computer room with top and bottom temperature sensor reading expression is shown on the picture below.

In addition, an user customizable dashboard and slide shows are available.
We will write more about the Zabbix configuration and creation of different graphs in another post.
Now we have good sensors to monitor the temperature in the datacenter. We have an excellent, open source platform for SNMP monitoring, which can collect, store, visualize temperature data and configure and generate alarms.
SNMP to 1-wire converter
Unfortunately, we are still missing the link between the 1-Wire interface and SNMP server. The best way to do that is by using Ethernet to 1-Wire server. Our team selected Ethernet to 1 Wire servers from Embedded Data Systems. More information about Embedded Data Systems products may be found at https://www.embeddeddatasystems.com
EDS have two devices HA7Net, which can handle up to 100 sensors and OW-SERVER-ENET-2, handling up to 22 sensors.


In order to ensure redundancy we recommend installing 3 devices of the same type. In case of technical failure, loss of power or loss of Ethernet connection of one unit you will still be able to monitor most of your sensors with the other two units.
With three HA7Net devices you will be able to monitor up to 50 cabinets, while OW-SERVER-ENET-2 will let you monitor 11 cabinets/racks.
The HA7Net supports a variety of 1-Wire devices at a high level. For example, reading the current temperature from a DS18S20 doesn't require the user to learn the details of reading and parsing scratchpads. Instead, you simply ask the HA7Net for the current temperature and it handles all of the required low-level communications for you. HA7Net works well with our temperature sensor DS18B20, described above.
The HA7Net will allow you to use industry standard Ethernet products (switches, hubs, etc.) to build out the backbone of your 1-Wire based sensor / control system. This provides several important benefits: Firstly, 1-Wire networks can be easily distributed over great distances without having to deal with the challenges associated with the installation of physically large 1-Wire networks. By designing your sensor networks in a distributed star topology, the individual 1-Wire MicroLans can be kept to a smaller physical size, thereby improving reliability and decreasing installation costs. Secondly, since the HA7Net communicates via TCP/IP over standard Ethernet, you can take advantage of existing LANs in the datacenter for building out and maintaining the backbone of your sensor network. Another advantage is the number of readily available libraries and developer tools which are widely available for common platforms, and can be used to communicate with the HA7Net.
How to Select Datacenter Location and Construct the Building
Ivan Shishkov
One of the very important decisions to make when building a datacenter is that the datacenter building is specially design and built to the purpose. Of course that is not always possible. Sometimes the building is rented and often it is not built on purpose to accommodate datacenter. In other cases the building was designed and build long time ago and not all current standards and good practices are accommodated. Sometimes implementing all special requirements is not possible or is not economically justified.
In this article we would like to share our vision of how to select the right location of a datacenter and how to design and construct the building. The considerations given below are valid also when, due to whatever reason, a decision to rent, instead of build is taken. Although we don’t recommend it, sometimes renting a premises is the only option.
Datacenter location
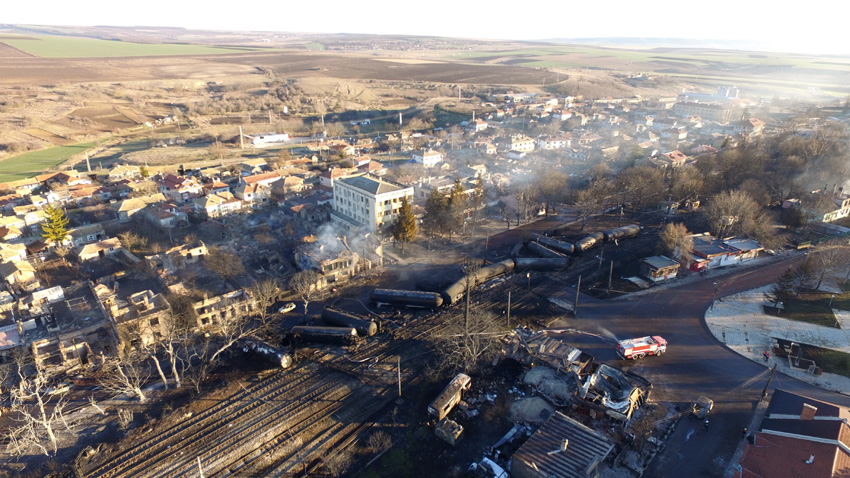
Let's start with selecting datacenter location. The careful selection of a datacenter site location is one of the most important decisions made at the early stage of Data center planning. Please bear in mind that often requirements are contradictive and fulfilling all of them is either impossible or may compromise performance. It is important to point that once selected, the location will stay forever. If all aspects and risks are not properly assessed that may have a long term effect on the datacenter operation. Often wrong locations may show no problems for decades until disaster strikes. Let’s have a look on the following example:
At 5:37 am on 10th of December 2016 a cargo train with propane-butan and propilen tanks, travelling from the town of Burgas to the town of Russe in Bulgaria derailed when entering railway station Hitrino. A leakage occurred from two of the wagons, which caused a fire. The fire and shock wave, generated during the ignition of the flammable gases, destroyed about 50 surrounding buildings and some people were buried and others suffered severe burns. An evacuation of all inhabitants of the village was done and 150 fire fighters managed to extinguish the fire by noon the same day.

About TSBG Hosting Ltd.
TSBG Hosting Ltd. (TSBG) was founded in 2006 and is incorporated under the laws of the Republic of Bulgaria.
EU VAT tax number: BG175059953
Managing Director: Ivan Shishkov
Get In Touch
Address: 8, Racho Dimchev str.
Sofia 1000, Bulgaria
Phone: +359 886 151048
Viber: +359 886 151048
Email: sales@tsbg.eu
Website: www.tsbg.eu